The USDCAD currency pair has seen its downward momentum accelerate, expanding its weekly trading range and solidifying the control of sellers in the market. Having broken through several important support thresholds, the pair is now eyeing the pivotal 200-day moving average, a level that analysts consider a crucial determinant for its near-term trajectory. This development follows a period of relatively constrained trading, with recent price action indicating a clear shift in market sentiment towards a more pronounced bearish outlook.
Earlier in the week, the USDCAD pair exhibited limited movement, trading within a narrow 56-pip range between its Monday high of 1.3964 and Wednesday's low of 1.3908. Despite this initial consolidation, market indications suggested a prevailing strength among sellers. This sentiment proved accurate, as the pair broke out of its range, descending to a new weekly low of 1.3868. This extension broadened the weekly trading spectrum to nearly 100 pips, a more substantial range though still modest compared to historical patterns.
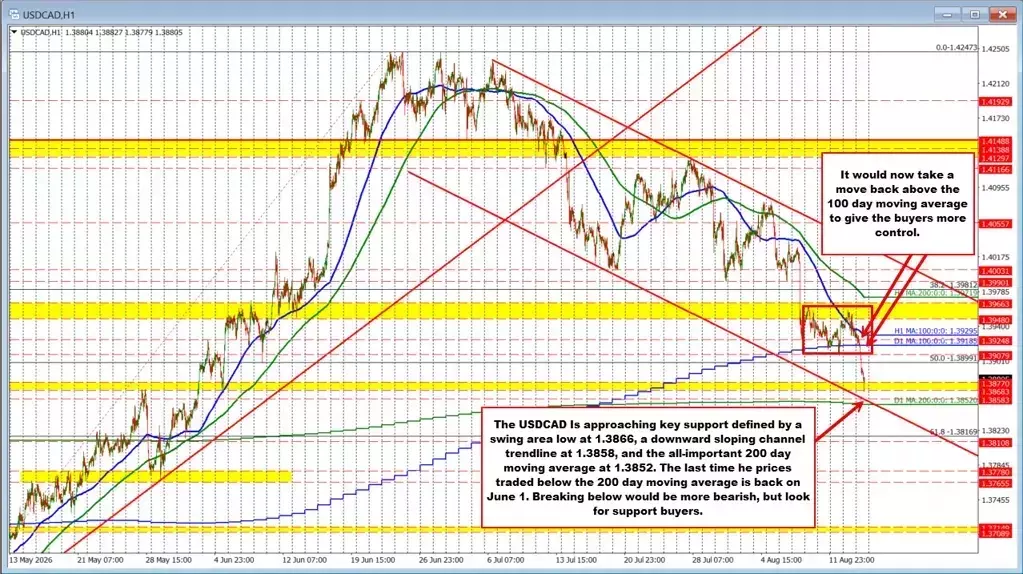
The recent descent forms part of a gradual, step-by-step decline initiated after USDCAD reached its peak in mid-June. From a technical standpoint, sellers have successfully cleared several critical hurdles. The price was unable to sustain gains above the resistance zone of 1.3948 to 1.3966. Subsequently, it fell below both the 100-hour moving average at 1.39295 and the 100-day moving average at 1.39185, further reinforcing the bearish trend.
Moreover, the pair breached the 50% retracement level of the rally from the May 1 low (around 1.3550) to the June 24 high (1.4247). This midpoint, situated at approximately 1.3899 or 1.3900, represents another significant technical achievement for sellers in the ongoing stepwise decline from the June high. The recent low of 1.3868 briefly pierced a swing area between 1.38683 and 1.3877, signaling continued downward pressure.
However, the decline temporarily stabilized just above two impending downside targets: a channel trendline near 1.3859 and the highly significant 200-day moving average at 1.3852. The 200-day moving average holds particular importance, as its last breach, around June 1, led to a sharp rebound that propelled the pair to its 2026 high of 1.4247 on June 24. Although the 200-day moving average has since adjusted higher to 1.3852, it remains a crucial indicator for both market participants.
Given its historical significance, a period of caution or consolidation might be observed as the price approaches the 200-day moving average for the first time. Sellers who initiated positions at higher levels may consider securing profits, while buyers might seek to capitalize on a potential bounce, using this level as a clear point for managing risk. Nevertheless, the prevailing market sentiment strongly favors the sellers. A decisive break below the 200-day moving average at 1.3852 would signal a notable bearish technical event, potentially paving the way for further declines. Conversely, a mere bounce from this average would not be sufficient to shift the technical outlook to bullish. A sustained move above the 100-day and 100-hour moving averages, positioned in the 1.3920–1.3930 range, would be required to challenge the sellers' dominance and instill greater confidence among buyers of a more substantial market reversal.
Currently, the USDCAD pair maintains a distinct downward trajectory, with the 200-day moving average at 1.3852 emerging as the next critical test for its ongoing market direction.